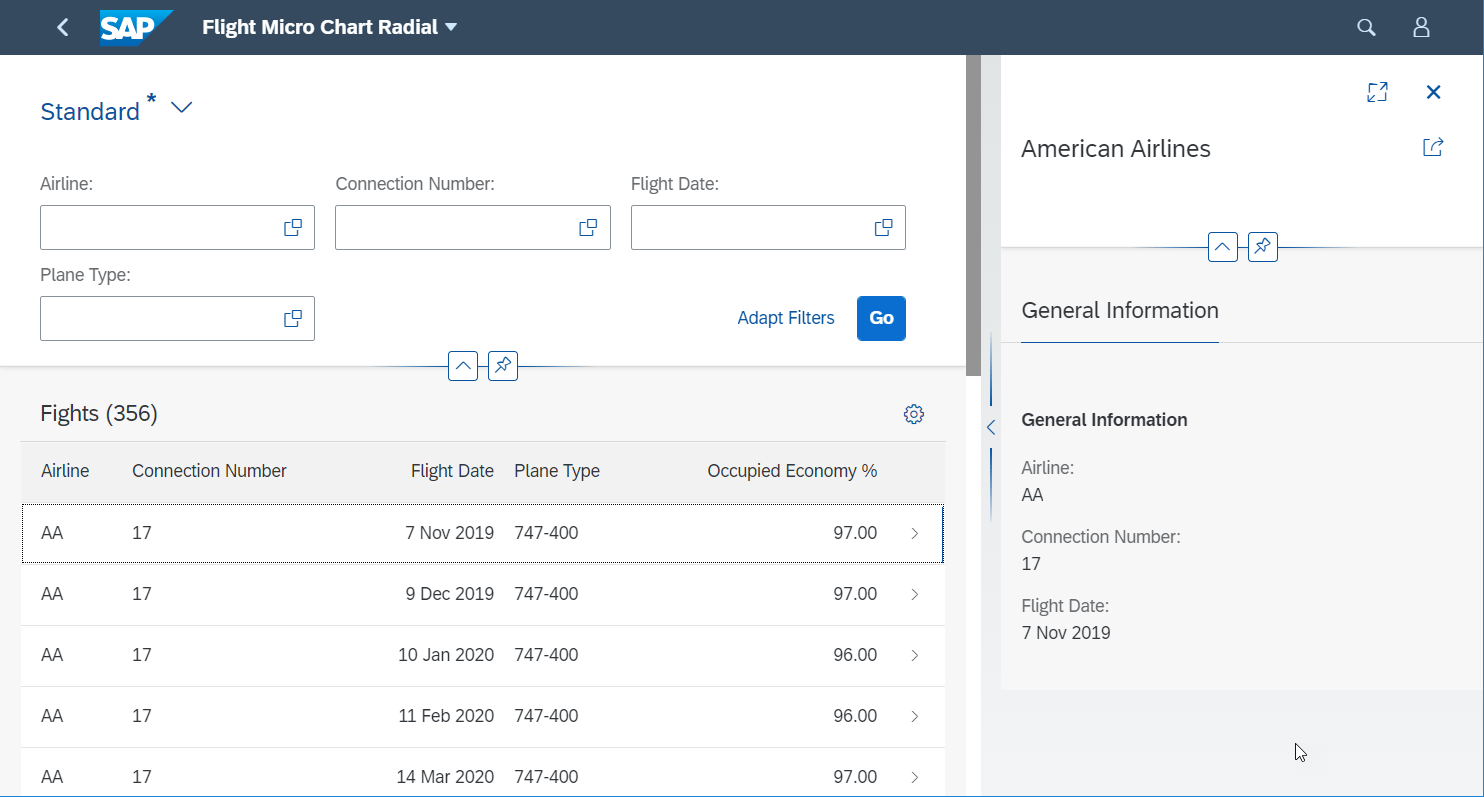
The blog explains how to use Radial Micro Chart in List and Object page with CDS Annotations. The radial chart displays a single percentage value. The chart consists of a coloured radial bar with a percentage value inside.
CDS ZI_FlightBooking
To start with I have CDS view ZI_FlightBooking exposing table SFLIGHT fields. As the Radial Micro Chart need value in percentage we have calculated fields OccupancyLevel_Economy, OccupancyLevel_Business and OccupancyLevel_First that can be used in Radial Micro Chart.
@AbapCatalog.sqlViewName: 'ZIFLBOOK'
@AbapCatalog.compiler.compareFilter: true
@AbapCatalog.preserveKey: true
@AccessControl.authorizationCheck: #CHECK
@EndUserText.label: 'Flight Booking'

define view ZI_FlightBooking
  as select from sflight
  association [*] to S_Bookings as _Bookings on  $projection.CarrierId    = _Bookings.CarrierId
                                             and $projection.ConnectionId = _Bookings.ConnectionId
                                             and $projection.FlightDate   = _Bookings.FlightDate
{

  key carrid                                        as CarrierId,
  key connid                                        as ConnectionId,
  key fldate                                        as FlightDate,

      planetype                                     as PlaneType,

      price                                         as Price,
      paymentsum                                    as TotalPayment,
      currency                                      as CurrencyCode,

      seatsmax                                      as Capacity_Economy,
      seatsocc                                      as Occupancy_Economy,

      seatsmax_b                                    as Capacity_Business,
      seatsocc_b                                    as Occupancy_Business,

      seatsmax_f                                    as Capacity_First,
      seatsocc_f                                    as Occupancy_First,

      division( seatsocc , seatsmax , 2 ) * 100     as OccupancyLevel_Economy,
      division( seatsocc_b , seatsmax_b , 2 ) * 100 as OccupancyLevel_Business,
      division( seatsocc_f , seatsmax_f , 2 ) * 100 as OccupancyLevel_First,

      _Bookings
}
CDS ZUIFlight_Chart
Secondly, I’ve CDS view ZUIFlight_Chart which is built on ZI_FlightBooking. Metadata extension is allowed and the rest of the annotation will be added in the metadata extension file.
@AbapCatalog.sqlViewName: 'ZUIFLTCHRT'
@AbapCatalog.compiler.compareFilter: true
@AbapCatalog.preserveKey: true
@AccessControl.authorizationCheck: #NOT_REQUIRED
@EndUserText.label: 'Flight Charts Demo'

@Metadata.allowExtensions: true

define view ZUIFlight_Chart
  as select from ZI_FlightBooking
  association [1] to S_Carrier as _Carrier on $projection.CarrierId = _Carrier.CarrierId
{
  key  CarrierId,
  key  ConnectionId,
  key  FlightDate,

       @Semantics.text: true
       _Carrier.Name as CarrierName,

       PlaneType,
       Occupancy_Economy,
       Capacity_Economy,
       OccupancyLevel_Economy,

       _Bookings,
       _Carrier
}
Metadata Extension
And this is metadata extension file which renders Fiori Element List Report with Object Page with identification facet in it.
@Metadata.layer: #CORE

@UI.headerInfo: { typeName: 'Flight' ,
                  typeNamePlural: 'Fights',
                  title: { value: 'CarrierName'  } }

annotate view ZUIFlight_Chart with
{
  @UI.facet: [
               { id:'idGeneralInformation' ,
                 type: #COLLECTION ,
                 label: 'General Information' ,
                 position: 10 } ,
               { type: #IDENTIFICATION_REFERENCE ,
                 label : 'General Information',
                 parentId: 'idGeneralInformation',
                 id: 'idIdentification' ,
                 position: 10 } ]

  @UI.selectionField: [{ position: 10 }]
  @UI.lineItem: [{ position: 10 }]
  @UI.identification: [{ position: 10 }]
  CarrierId;

  @UI.selectionField: [{ position: 20 }]
  @UI.lineItem: [{ position: 20 }]
  @UI.identification: [{ position: 20 }]
  ConnectionId;

  @UI.selectionField: [{ position: 30 }]
  @UI.lineItem: [{ position: 30 }]
  @UI.identification: [{ position: 30 }]
  FlightDate;

  @UI.selectionField: [{ position: 40 }]
  @UI.lineItem: [{ position: 40 }]
  PlaneType;

  @UI.lineItem: [{ position: 60 }]
  @EndUserText.label: 'Occupied Economy %'
  OccupancyLevel_Economy;
}
List Report and Object Page
At this point you will get this List Report an Object Page app in WebIDE.
Next we will look at Radial Micro Chart related annotations.
Radial Micro Chart Annotations
Following annotations are added Metadata Extension file
@UI.chart – this defined Radial micro chart with field OccupancyLevel_Economy which will be used to render the chart.
@UI.lineItem – here type: #AS_CHART is defined. Qualifier for UI.chart annotaion is specified valueQualifier: ‘chrtRadial’.
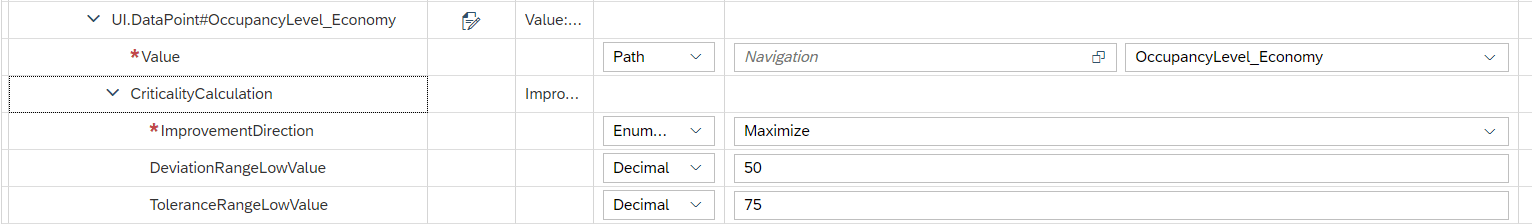
@UI.dataPoint – semantic colours are specified using @UI.dataPoint.criticalityCalculation. I am using improvementDirection: # MAXIMIZE scenario. For this direction, values less than deviationRangeLowValue: 50 will appear as red, values more than toleranceRangeLowValue: 75.00 will appear in green, rest in yellow.

For information – there are two more importmentDirection scenarios namely #MINIMIZE and #TARGET which can be used. More on this topic is available on this SAP link.


@Metadata.layer: #CORE
@UI.headerInfo: { typeName: 'Flight' ,
typeNamePlural: 'Fights',
title: { value: 'CarrierName' } }
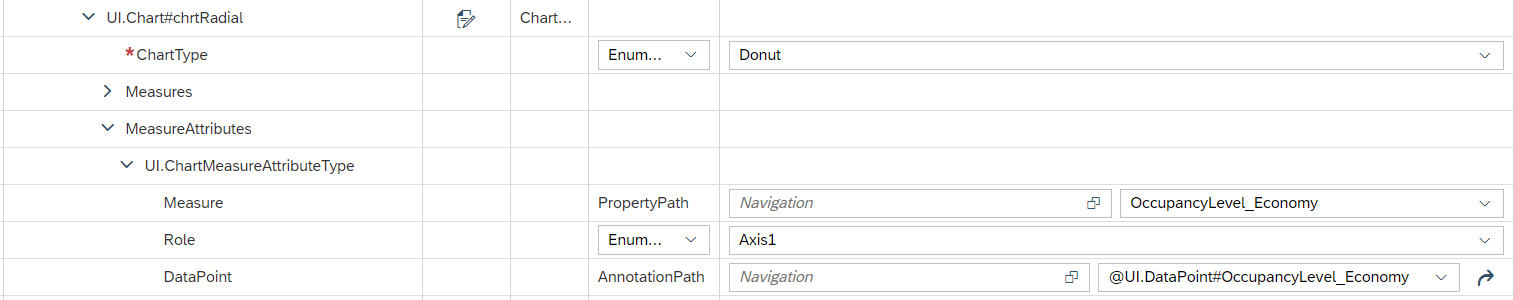
@UI.chart: [{ qualifier: 'chrtRadial' ,
chartType: #DONUT ,
measures: ['OccupancyLevel_Economy'],
measureAttributes: [{
measure: 'OccupancyLevel_Economy' ,
role: #AXIS_1,
asDataPoint: true
}]
}]
annotate view ZUIFlight_Chart with
{
@UI.facet: [
{ id:'idGeneralInformation' ,
type: #COLLECTION ,
label: 'General Information' ,
position: 10 } ,
{ type: #IDENTIFICATION_REFERENCE ,
label : 'General Information',
parentId: 'idGeneralInformation',
id: 'idIdentification' ,
position: 10 } ]
@UI.selectionField: [{ position: 10 }]
@UI.lineItem: [{ position: 10 }]
@UI.identification: [{ position: 10 }]
CarrierId;
@UI.selectionField: [{ position: 20 }]
@UI.lineItem: [{ position: 20 }]
@UI.identification: [{ position: 20 }]
ConnectionId;
@UI.selectionField: [{ position: 30 }]
@UI.lineItem: [{ position: 30 }]
@UI.identification: [{ position: 30 }]
FlightDate;
@UI.selectionField: [{ position: 40 }]
@UI.lineItem: [{ position: 40 }]
PlaneType;
@UI.lineItem: [{ position: 60,
type: #AS_CHART ,
valueQualifier: 'chrtRadial',
label: 'Occupancy Economy'}]
@UI.dataPoint: { criticalityCalculation:{
improvementDirection: #MAXIMIZE ,
deviationRangeLowValue: 50.00 ,
toleranceRangeLowValue: 75.00 } }
@EndUserText.label: 'Occupied Economy %'
OccupancyLevel_Economy;
}
These annotation renders Radial Micro Chart with semantic colours.

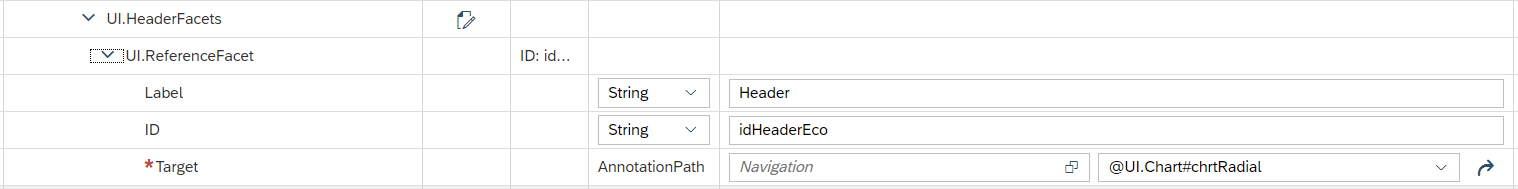
HeaderFacet
To add Radial Micro Chart in Object Page use facet of type: #CHART_REFERENCE.
@Metadata.layer: #CORE

@UI.headerInfo: { typeName: 'Flight' ,
                  typeNamePlural: 'Fights',
                  title: { value: 'CarrierName'  } }

@UI.chart: [{ qualifier: 'chrtRadial' ,
              chartType:         #DONUT ,
              measures:          ['OccupancyLevel_Economy'],
              measureAttributes: [{
                    measure:     'OccupancyLevel_Economy' ,
                    role: #AXIS_1,
                    asDataPoint: true
                    }]
             }]

annotate view ZUIFlight_Chart with
{
  @UI.facet: [
               { id : 'idHeaderEco' ,
                   type: #CHART_REFERENCE ,
                   label: 'Header' ,
                   purpose: #HEADER ,
                   targetQualifier: 'chrtRadial'} ,
               { id:'idGeneralInformation' ,
                 type: #COLLECTION ,
                 label: 'General Information' ,
                 position: 10 } ,
               { type: #IDENTIFICATION_REFERENCE ,
                 label : 'General Information',
                 parentId: 'idGeneralInformation',
                 id: 'idIdentification' ,
                 position: 10 } ]


  @UI.selectionField: [{ position: 10 }]
  @UI.lineItem: [{ position: 10 }]
  @UI.identification: [{ position: 10 }]
  CarrierId;

  @UI.selectionField: [{ position: 20 }]
  @UI.lineItem: [{ position: 20 }]
  @UI.identification: [{ position: 20 }]
  ConnectionId;

  @UI.selectionField: [{ position: 30 }]
  @UI.lineItem: [{ position: 30 }]
  @UI.identification: [{ position: 30 }]
  FlightDate;


  @UI.selectionField: [{ position: 40 }]
  @UI.lineItem: [{ position: 40 }]
  PlaneType;

  @UI.lineItem: [{ position: 60,
                   type: #AS_CHART ,
                   valueQualifier: 'chrtRadial',
                   label: 'Occupancy Economy'}]
  @UI.dataPoint: {  criticalityCalculation:{
                      improvementDirection: #MAXIMIZE ,
                      deviationRangeLowValue: 50.00 ,
                      toleranceRangeLowValue: 75.00 } }
  @EndUserText.label: 'Occupied Economy %'
  OccupancyLevel_Economy;

}
Radial Micro Chart now renders on Object Page.

Below XML annotation and screen shot from Annotation Modeler. This would help if you need to develop this using location annotation instead of CDS,
XML Annotation
Chart
<Annotation Term="UI.Chart" Qualifier="chrtRadial">
	<Record Type="UI.ChartDefinitionType">
		<PropertyValue Property="ChartType" EnumMember="UI.ChartType/Donut"/>
		<PropertyValue Property="Measures">
			<Collection>
				<PropertyPath>OccupancyLevel_Economy</PropertyPath>
			</Collection>
		</PropertyValue>
		<PropertyValue Property="MeasureAttributes">
			<Collection>
				<Record Type="UI.ChartMeasureAttributeType">
					<PropertyValue Property="Measure" PropertyPath="OccupancyLevel_Economy"/>
					<PropertyValue Property="Role" EnumMember="UI.ChartMeasureRoleType/Axis1"/>
					<PropertyValue Property="DataPoint" AnnotationPath="@UI.DataPoint#OccupancyLevel_Economy"/>
				</Record>
			</Collection>
		</PropertyValue>
	</Record>
</Annotation>
DataPoint
<Annotation Term="UI.DataPoint" Qualifier="OccupancyLevel_Economy">
	<Record Type="UI.DataPointType">
		<PropertyValue Property="Value" Path="OccupancyLevel_Economy"/>
		<PropertyValue Property="CriticalityCalculation">
			<Record Type="UI.CriticalityCalculationType">
				<PropertyValue Property="ImprovementDirection" EnumMember="UI.ImprovementDirectionType/Maximize"/>
				<PropertyValue Property="DeviationRangeLowValue" Decimal="50"/>
				<PropertyValue Property="ToleranceRangeLowValue" Decimal="75"/>
			</Record>
		</PropertyValue>
	</Record>
</Annotation>
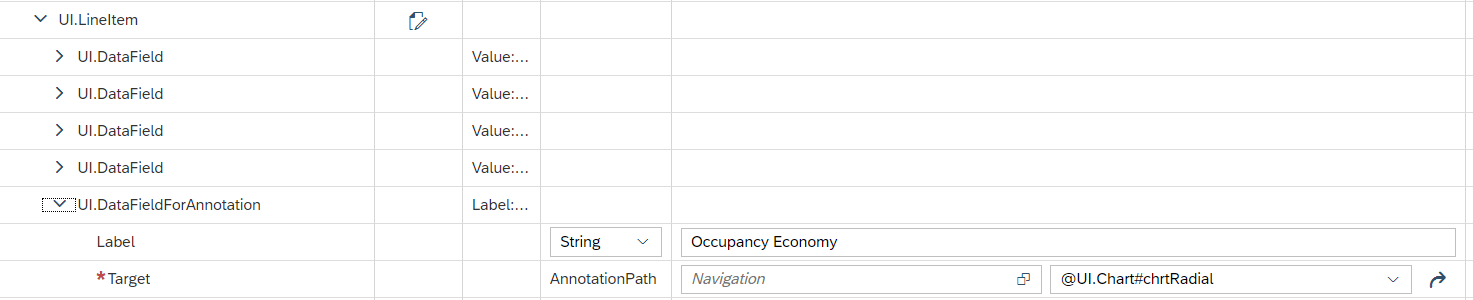
LineItem
<Annotation Term="UI.LineItem">
	<Collection>
		<Record Type="UI.DataField">
			<PropertyValue Property="Value" Path="CarrierId"/>
		</Record>
		<Record Type="UI.DataField">
			<PropertyValue Property="Value" Path="ConnectionId"/>
		</Record>
		<Record Type="UI.DataField">
			<PropertyValue Property="Value" Path="FlightDate"/>
		</Record>
		<Record Type="UI.DataField">
			<PropertyValue Property="Value" Path="PlaneType"/>
		</Record>
		<Record Type="UI.DataFieldForAnnotation">
			<PropertyValue Property="Label" String="Occupancy Economy"/>
			<PropertyValue Property="Target" AnnotationPath="@UI.Chart#chrtRadial"/>
		</Record>
	</Collection>
</Annotation>
HeaderFacet
<Annotation Term="UI.HeaderFacets">
	<Collection>
		<Record Type="UI.ReferenceFacet">
			<PropertyValue Property="Label" String="Header"/>
			<PropertyValue Property="ID" String="idHeaderEco"/>
			<PropertyValue Property="Target" AnnotationPath="@UI.Chart#chrtRadial"/>
		</Record>
	</Collection>
</Annotation>
Annotation Modeler
Chart
DataPoint
LineItem
HeaderFacet