The blog explains how to use Progress Bar in List and Object page with CDS Annotations.
We will use data from table SFLIGHT table which contains the number of seats available in the economy, business and first-class and respective occupied seat. We will use the progress indicator to visualise occupied seats against the total number of seats in each class.
CDS ZI_FlightBooking
To start with I have this CDS view ZI_FlightBooking which exposes the SFLIGHT fields.
@AbapCatalog.sqlViewName: 'ZIFLBOOK'
@AbapCatalog.compiler.compareFilter: true
@AbapCatalog.preserveKey: true
@AccessControl.authorizationCheck: #CHECK
@EndUserText.label: 'Flight Booking'

define view ZI_FlightBooking
  as select from sflight
  association [*] to S_Bookings as _Bookings
            on  $projection.CarrierId    = _Bookings.CarrierId and
                $projection.ConnectionId = _Bookings.ConnectionId and
                $projection.FlightDate   = _Bookings.FlightDate
{

  key carrid     as CarrierId,
  key connid     as ConnectionId,
  key fldate     as FlightDate,
      planetype  as PlaneType,
      price      as Price,
      paymentsum as TotalPayment,
      currency   as CurrencyCode,
      seatsmax   as Capacity_Economy,
      seatsocc   as Occupancy_Economy,
      seatsmax_b as Capacity_Business,
      seatsocc_b as Occupancy_Business,
      seatsmax_f as Capacity_First,
      seatsocc_f as Occupancy_First,

      _Bookings
}
CDS ZFlight
Secondly, I’ve CDS view ZFlight which is built on ZI_FlightBooking. We are going to defined metadata extension on this CDS and also enriching the data with some more annotation.
@AbapCatalog.sqlViewName: 'ZFLIGHT1'
@AbapCatalog.compiler.compareFilter: true
@AbapCatalog.preserveKey: true
@AccessControl.authorizationCheck: #CHECK
@EndUserText.label: 'Flight'

@Metadata.allowExtensions: true

define view ZFlight
  as select from ZI_FlightBooking
  association [1] to S_Carrier
       as _Carrier on $projection.CarrierId = _Carrier.CarrierId
{
      @ObjectModel.text.element: ['CarrierName']
  key CarrierId,
  key ConnectionId,
  key FlightDate,

      @Semantics.text: true
      _Carrier.Name as CarrierName,
      PlaneType,
      Price,

      @Semantics.amount.currencyCode: 'CurrencyCode'
      TotalPayment,

      @Semantics.currencyCode: true
      CurrencyCode,

      Capacity_Economy,
      Occupancy_Economy,
      Capacity_Business,
      Occupancy_Business,
      Capacity_First,
      Occupancy_First,

      _Bookings,
      _Carrier
}
Metadata Extension
Thirdly, I’ve this metadata extension file which renders Fiori Element List Report with Object Page with identification facet in it.
@Metadata.layer: #CORE

@UI.headerInfo: { typeName: 'Flight' ,
                  typeNamePlural: 'Fights',
                  title: { value: 'CarrierName'  } }

annotate view ZFlight with
{
  @UI.facet: [
               { id:'idGeneralInformation' ,
                 type: #COLLECTION ,
                 label: 'General Information' ,
                 position: 10 } ,
               { type: #IDENTIFICATION_REFERENCE ,
                 label : 'General Information',
                 parentId: 'idGeneralInformation',
                 id: 'idIdentification' ,
                 position: 10 } ]

  @UI.selectionField: [{ position: 10 }]
  @UI.lineItem: [{ position: 10 }]
  @UI.identification: [{ position: 10 }]
  CarrierId;

  @UI.selectionField: [{ position: 20 }]
  @UI.lineItem: [{ position: 20 }]
  @UI.identification: [{ position: 20 }]
  ConnectionId;

  @UI.selectionField: [{ position: 30 }]
  @UI.lineItem: [{ position: 30 }]
  @UI.identification: [{ position: 30 }]
  FlightDate;

  @UI.selectionField: [{ position: 40 }]
  @UI.lineItem: [{ position: 40 }]
  PlaneType;

  @UI.lineItem: [{ position: 50 }]
  TotalPayment;

  @UI.lineItem: [{ position: 60 }]
  Occupancy_Economy;

  @UI.lineItem: [{ position: 70 }]
  Occupancy_Business;

  @UI.lineItem: [{ position: 80 }]
  Occupancy_First;
}
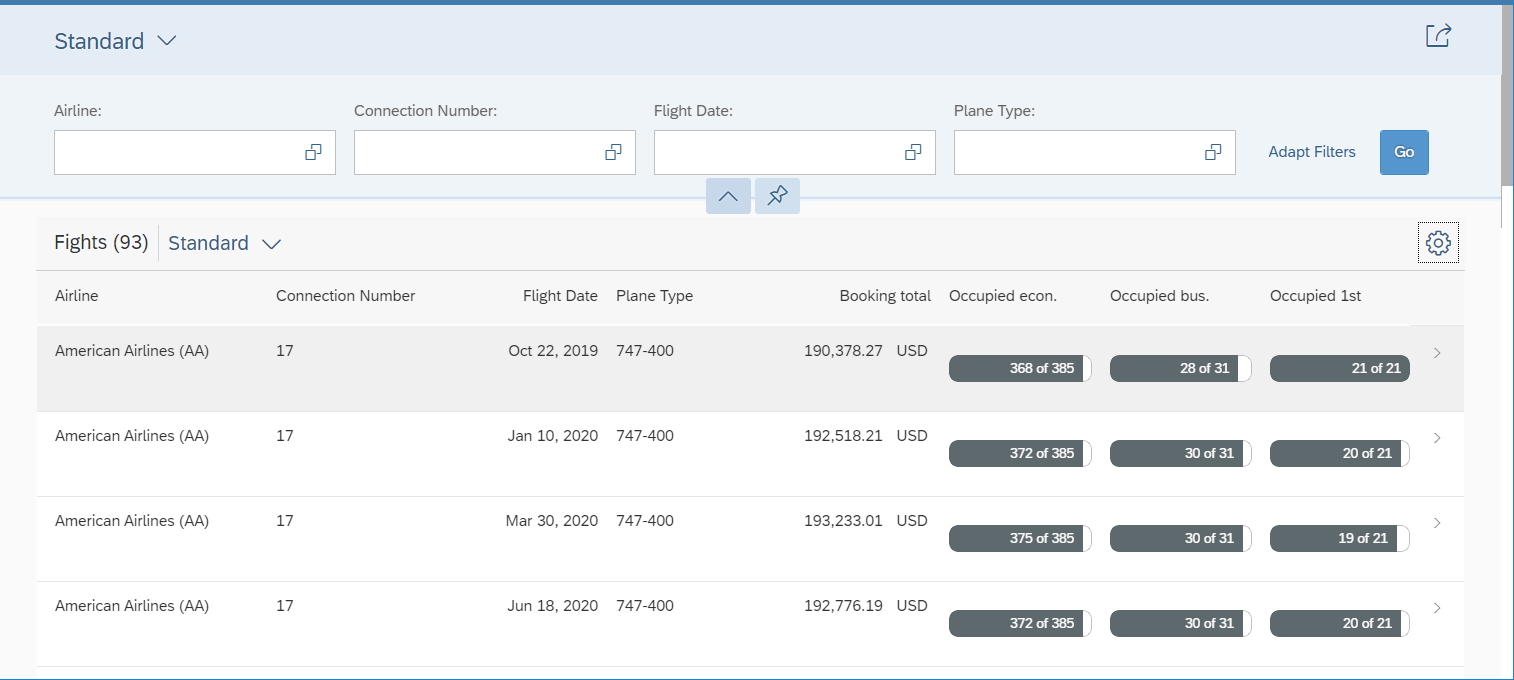
With these CDS and Metadata extension, we have basic app working

Progress Bar Annotation
Let’s see annotations to visualise the Occupied seat as a progress bar against the total seat in that class.
In @UI.lineitem annotation of fields Occupancy_Economy, Occupancy_Business and Occupancy_First, change the field type to datapoint using type: #DATAPOINT. Add another annotation @UI.datapoint with visualization: #PROGRESS and field name where the target value is. For example, Occupancy_Economy field’s targetValueElement: ‘Capacity_Economy’.
@Metadata.layer: #CORE

@UI.headerInfo: { typeName: 'Flight' ,
                  typeNamePlural: 'Fights',
                  title: { value: 'CarrierName'  } }

annotate view ZFlight with
{
  @UI.facet: [
               { id:'idGeneralInformation' ,
                 type: #COLLECTION ,
                 label: 'General Information' ,
                 position: 10 } ,
               { type: #IDENTIFICATION_REFERENCE ,
                 label : 'General Information',
                 parentId: 'idGeneralInformation',
                 id: 'idIdentification' ,
                 position: 10 } ]

  @UI.selectionField: [{ position: 10 }]
  @UI.lineItem: [{ position: 10 }]
  @UI.identification: [{ position: 10 }]
  CarrierId;

  @UI.selectionField: [{ position: 20 }]
  @UI.lineItem: [{ position: 20 }]
  @UI.identification: [{ position: 20 }]
  ConnectionId;

  @UI.selectionField: [{ position: 30 }]
  @UI.lineItem: [{ position: 30 }]
  @UI.identification: [{ position: 30 }]
  FlightDate;

  @UI.selectionField: [{ position: 40 }]
  @UI.lineItem: [{ position: 40 }]
  PlaneType;

  @UI.lineItem: [{ position: 50 }]
  TotalPayment;

  @UI.lineItem: [{ position: 60 , type: #AS_DATAPOINT}]
  @UI.dataPoint: { visualization: #PROGRESS ,
                   targetValueElement: 'Capacity_Economy' }
  Occupancy_Economy;

  @UI.lineItem: [{ position: 70 , type: #AS_DATAPOINT}]
  @UI.dataPoint: { visualization: #PROGRESS ,
                   targetValueElement: 'Capacity_Business' }
  Occupancy_Business;

  @UI.lineItem: [{ position: 80 , type: #AS_DATAPOINT}]
  @UI.dataPoint: { visualization: #PROGRESS ,
                   targetValueElement: 'Capacity_First' }
  Occupancy_First;
}
In list report, you should now see values being displayed as progress bar against target capacity values.
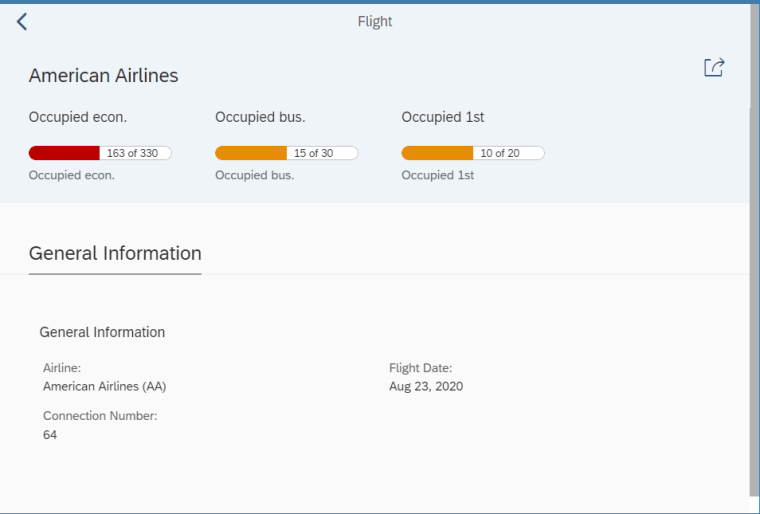
Object Page Facet
On Object Page, you’ll notice fields which we changed into type: #DATAPOINT are being displayed header. However, they are not rendered as a progress bar. Lets fixed that.

To properly render the datapoints with its visualisation annotation we need to add header facet of type: #DATAPOINT_REFERENCE and point it to the respective field which has datapoint reference annotation (using targetQualifier).
@Metadata.layer: #CORE

@UI.headerInfo: { typeName: 'Flight' ,
                  typeNamePlural: 'Fights',
                  title: { value: 'CarrierName'  } }

annotate view ZFlight with
{
  @UI.facet: [
                 { id : 'idHeaderEco' ,
                   type: #DATAPOINT_REFERENCE ,
                   label: 'Header' ,
                   purpose: #HEADER ,
                   targetQualifier: 'Occupancy_Economy'} ,
                 { id : 'idHeaderBus' ,
                   type: #DATAPOINT_REFERENCE ,
                   label: 'Header' ,
                   purpose: #HEADER ,
                   targetQualifier: 'Occupancy_Business'} ,
                 { id : 'idHeaderFirst' ,
                   type: #DATAPOINT_REFERENCE ,
                   label: 'Header' ,
                   purpose: #HEADER ,
                   targetQualifier: 'Occupancy_First'} ,
               { id:'idGeneralInformation' ,
                 type: #COLLECTION ,
                 label: 'General Information' ,
                 position: 10 } ,
               { type: #IDENTIFICATION_REFERENCE ,
                 label : 'General Information',
                 parentId: 'idGeneralInformation',
                 id: 'idIdentification' ,
                 position: 10 } ]


  @UI.selectionField: [{ position: 10 }]
  @UI.lineItem: [{ position: 10 }]
  @UI.identification: [{ position: 10 }]
  CarrierId;

  @UI.selectionField: [{ position: 20 }]
  @UI.lineItem: [{ position: 20 }]
  @UI.identification: [{ position: 20 }]
  ConnectionId;

  @UI.selectionField: [{ position: 30 }]
  @UI.lineItem: [{ position: 30 }]
  @UI.identification: [{ position: 30 }]
  FlightDate;

  @UI.selectionField: [{ position: 40 }]
  @UI.lineItem: [{ position: 40 }]
  PlaneType;

  @UI.lineItem: [{ position: 50 }]
  TotalPayment;

  @UI.lineItem: [{ position: 60 , type: #AS_DATAPOINT}]
  @UI.dataPoint: { visualization: #PROGRESS ,
                   targetValueElement: 'Capacity_Economy' }
  Occupancy_Economy;

  @UI.lineItem: [{ position: 70 , type: #AS_DATAPOINT}]
  @UI.dataPoint: { visualization: #PROGRESS ,
                   targetValueElement: 'Capacity_Business' }
  Occupancy_Business;

  @UI.lineItem: [{ position: 80 , type: #AS_DATAPOINT}]
  @UI.dataPoint: { visualization: #PROGRESS ,
                   targetValueElement: 'Capacity_First' }
  Occupancy_First;
}
After these datapoint reference facets you should see progress bar in Object Page.

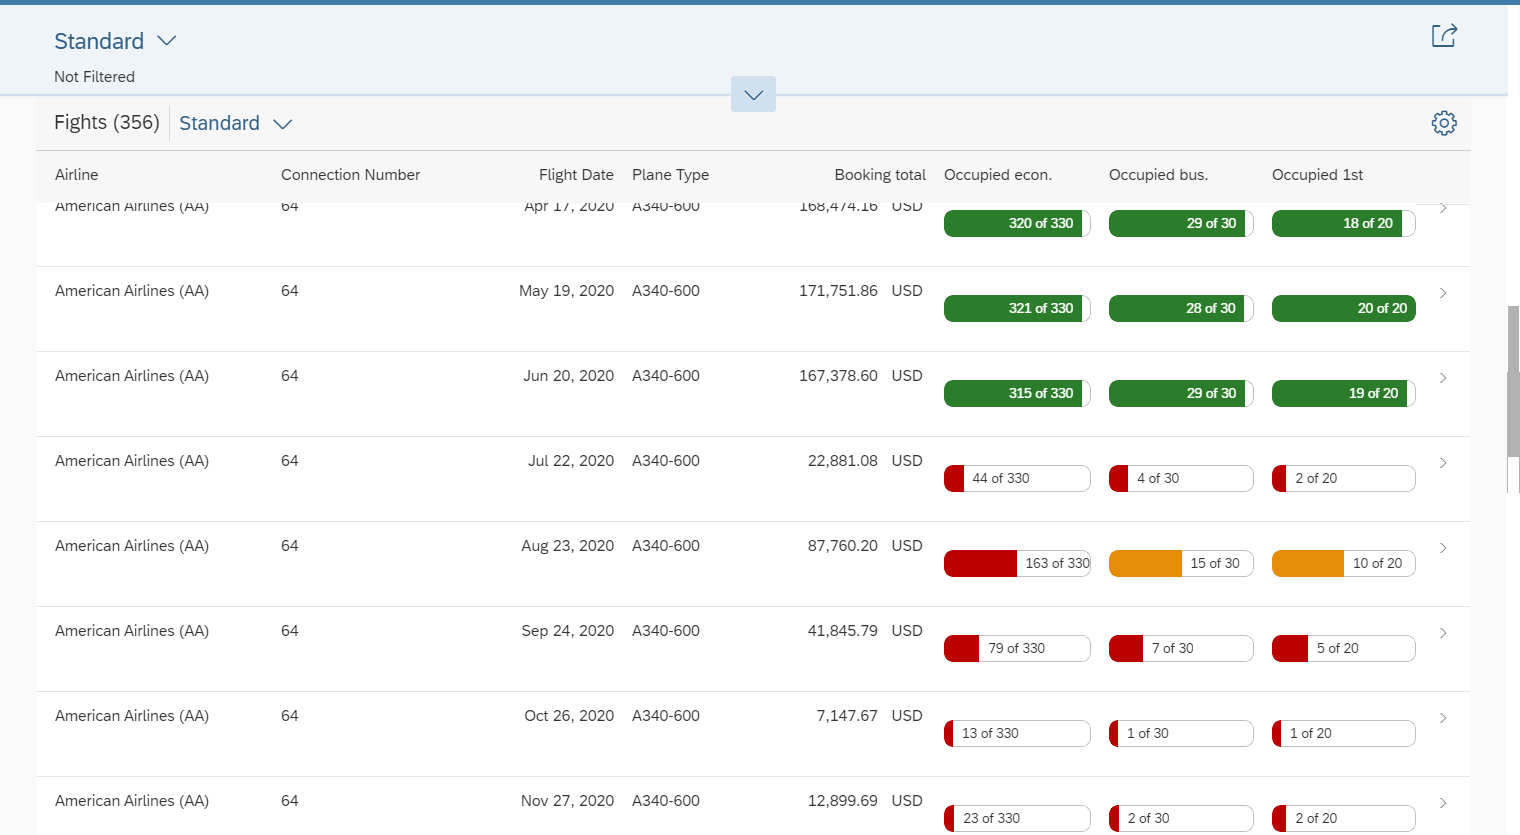
Semantic Colors
Next, we will put semantic colours to progress bar to colour code occupancy level in each class. If occupancy level is more than 75% it will appear in Green, occupancy level between 50-75% will appear as yellow and less than 50% will be red.
Step 1: Adding three new calculation fields in CDS view ZI_FlightBooking to get occupancy level for each class.
@AbapCatalog.sqlViewName: 'ZIFLBOOK'
@AbapCatalog.compiler.compareFilter: true
@AbapCatalog.preserveKey: true
@AccessControl.authorizationCheck: #CHECK
@EndUserText.label: 'Flight Booking'

define view ZI_FlightBooking
  as select from sflight
  association [*] to S_Bookings as _Bookings on  $projection.CarrierId    = _Bookings.CarrierId
                                             and $projection.ConnectionId = _Bookings.ConnectionId
                                             and $projection.FlightDate   = _Bookings.FlightDate
{

  key carrid                                        as CarrierId,
  key connid                                        as ConnectionId,
  key fldate                                        as FlightDate,

      planetype                                     as PlaneType,

      price                                         as Price,
      paymentsum                                    as TotalPayment,
      currency                                      as CurrencyCode,

      seatsmax                                      as Capacity_Economy,

      seatsocc                                      as Occupancy_Economy,
      seatsmax_b                                    as Capacity_Business,
      seatsocc_b                                    as Occupancy_Business,
      seatsmax_f                                    as Capacity_First,
      seatsocc_f                                    as Occupancy_First,

      division( seatsocc , seatsmax , 2 ) * 100     as OccupancyLevel_Economy,
      division( seatsocc_b , seatsmax_b , 2 ) * 100 as OccupancyLevel_Business,
      division( seatsocc_f , seatsmax_f , 2 ) * 100 as OccupancyLevel_First,

      _Bookings
}
Semantic colour for a fields is also known as criticality. Below are values for each criticality level.
| Value | Description | Visualization in Color |
|---|---|---|
| 1 | Negative | Red |
| 2 | Critical | Yellow |
| 3 | Positive | Green |
Using values in OccupancyLevel_Economy, OccupancyLevel_Business and OccupancyLevel field we’ll have to derive the criticality value. This criticality value field will then be used in annotation @UI.dataPoint.criticality.
Step 2: Adding criticality calculation fields CriticalEconomy, CriticalBusiness and CriticalFirst in CDS view ZFlight.
@AbapCatalog.sqlViewName: 'ZFLIGHT1'
@AbapCatalog.compiler.compareFilter: true
@AbapCatalog.preserveKey: true
@AccessControl.authorizationCheck: #CHECK
@EndUserText.label: 'Flight'

@Metadata.allowExtensions: true

define view ZFlight
  as select from ZI_FlightBooking
  association [1] to S_Carrier as _Carrier on $projection.CarrierId = _Carrier.CarrierId
{
      @ObjectModel.text.element: ['CarrierName']
  key CarrierId,
  key ConnectionId,
  key FlightDate,

      @Semantics.text: true
      _Carrier.Name   as CarrierName,
      PlaneType,
      Price,

      @Semantics.amount.currencyCode: 'CurrencyCode'
      TotalPayment,

      @Semantics.currencyCode: true
      CurrencyCode,

      Capacity_Economy,
      Occupancy_Economy,
      Capacity_Business,
      Occupancy_Business,
      Capacity_First,
      Occupancy_First,

      case when OccupancyLevel_Economy >= 75 then 3
           when OccupancyLevel_Economy >= 50 then 2
           else 1 end as CriticalEconomy,

      case when OccupancyLevel_Business >= 75 then 3
           when OccupancyLevel_Business >= 50 then 2
           else 1 end as CriticalBusiness,

      case when OccupancyLevel_First >= 75 then 3
           when OccupancyLevel_First >= 50 then 2
           else 1 end as CriticalFirst,

      _Bookings,
      _Carrier
}
Step 3: Using annotation @UI.dataPoint.criticality to assigned criticality value to the progress bar.
@Metadata.layer: #CORE

@UI.headerInfo: { typeName: 'Flight' ,
                  typeNamePlural: 'Fights',
                  title: { value: 'CarrierName'  } }

annotate view ZFlight with
{
  @UI.facet: [
                 { id : 'idHeaderEco' ,
                   type: #DATAPOINT_REFERENCE ,
                   label: 'Header' ,
                   purpose: #HEADER ,
                   targetQualifier: 'Occupancy_Economy'} ,
                 { id : 'idHeaderBus' ,
                   type: #DATAPOINT_REFERENCE ,
                   label: 'Header' ,
                   purpose: #HEADER ,
                   targetQualifier: 'Occupancy_Business'} ,
                 { id : 'idHeaderFirst' ,
                   type: #DATAPOINT_REFERENCE ,
                   label: 'Header' ,
                   purpose: #HEADER ,
                   targetQualifier: 'Occupancy_First'} ,
               { id:'idGeneralInformation' ,
                 type: #COLLECTION ,
                 label: 'General Information' ,
                 position: 10 } ,
               { type: #IDENTIFICATION_REFERENCE ,
                 label : 'General Information',
                 parentId: 'idGeneralInformation',
                 id: 'idIdentification' ,
                 position: 10 } ]

  @UI.selectionField: [{ position: 10 }]
  @UI.lineItem: [{ position: 10 }]
  @UI.identification: [{ position: 10 }]
  CarrierId;

  @UI.selectionField: [{ position: 20 }]
  @UI.lineItem: [{ position: 20 }]
  @UI.identification: [{ position: 20 }]
  ConnectionId;

  @UI.selectionField: [{ position: 30 }]
  @UI.lineItem: [{ position: 30 }]
  @UI.identification: [{ position: 30 }]
  FlightDate;

  @UI.selectionField: [{ position: 40 }]
  @UI.lineItem: [{ position: 40 }]
  PlaneType;

  @UI.lineItem: [{ position: 50 }]
  TotalPayment;

  @UI.lineItem: [{ position: 60 , type: #AS_DATAPOINT}]
  @UI.dataPoint: { visualization: #PROGRESS ,
                   targetValueElement: 'Capacity_Economy' ,
                   criticality: 'CriticalEconomy' }
  Occupancy_Economy;

  @UI.lineItem: [{ position: 70 , type: #AS_DATAPOINT}]
  @UI.dataPoint: { visualization: #PROGRESS ,
                   targetValueElement: 'Capacity_Business' ,
                   criticality: 'CriticalBusiness'}
  Occupancy_Business;

  @UI.lineItem: [{ position: 80 , type: #AS_DATAPOINT}]
  @UI.dataPoint: { visualization: #PROGRESS ,
                   targetValueElement: 'Capacity_First' ,
                   criticality: 'CriticalFirst' }
  Occupancy_First;
}
Results: